The Nouran Report
This project was meant to teach me the importance of graphs and data, and how to display information in a simple, but creative way.
I was tasked with looking into my own life and the characteristics that make me who I am, so that I could show those characteristics of my life in different graph forms!
It was very interesting to see how little sleep I get most days or what kind of music I listened to during this period of my life. Tracking how many times I apologize on a daily basis was incredibly difficult because it just happens so naturally, but it was still incredibly insightful!
Our human characteristics are so silly.
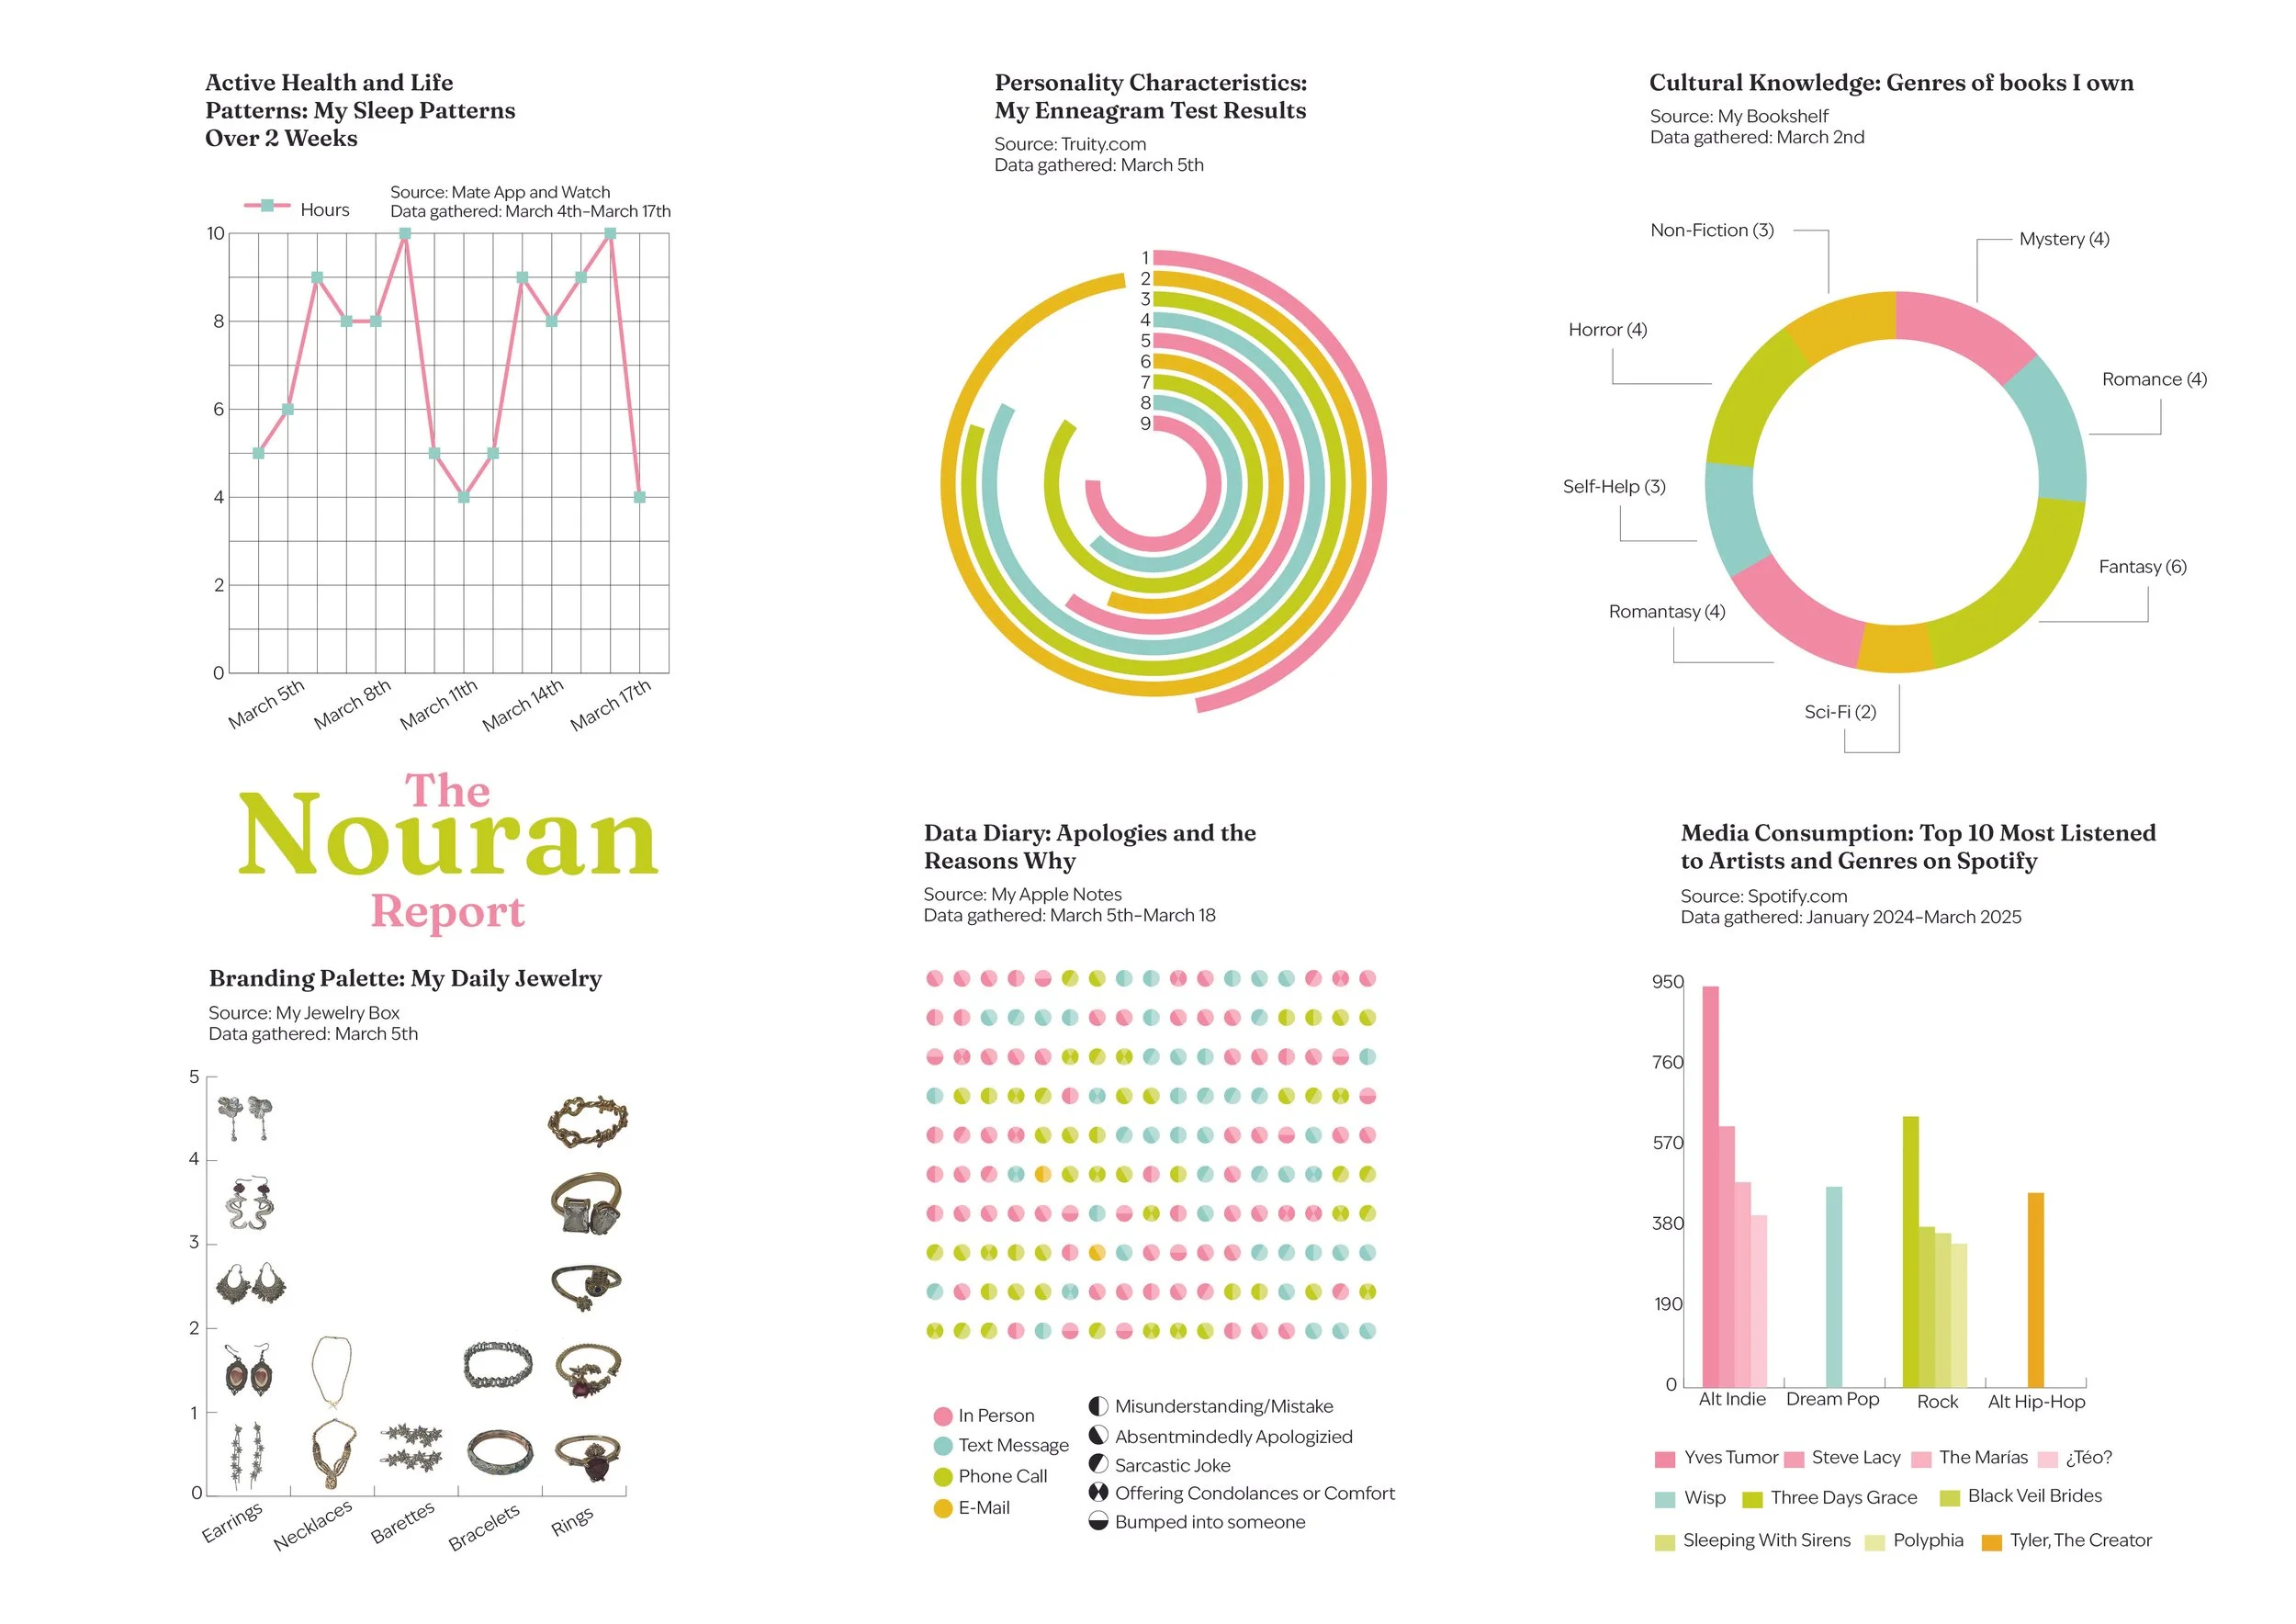
Nouran Badawy | The Nouran Report | Illustrator | 2024